
Introduction
In today’s data-driven world, businesses generate massive amounts of data on a daily basis. Analyzing and interpreting this data is crucial for making informed decisions. Google Cloud Platform (GCP) offers a powerful tool for data visualization and reporting called Google Data Studio. In this comprehensive guide, we will explore the features, benefits, and best practices of GCP Data Studio Reporting, and how businesses can leverage it to create insightful and visually appealing reports.
Understanding Google Data Studio
What is Google Data Studio?
Google Data Studio stands as a prominent and free business intelligence and data visualization tool within Google’s suite of services. This tool empowers users to craft personalized and interactive reports and dashboards by leveraging data from diverse sources. Whether the goal is to scrutinize marketing performance, monitor sales metrics, or track website analytics, Data Studio offers a user-friendly interface that transforms raw data into compelling visualizations.
Key Features of Google Data Studio
- Connectivity: A notable strength of Data Studio lies in its seamless integration with various data sources, including but not limited to Google Analytics, Google Ads, Google Sheets, and BigQuery. This ensures that users can effortlessly amalgamate data from disparate platforms, presenting a comprehensive view in a singular, cohesive report.
- Drag-and-Drop Interface: Data Studio distinguishes itself through an intuitive drag-and-drop interface. This feature eliminates the need for intricate coding or advanced design skills, allowing users to effortlessly incorporate charts, tables, and other visual elements into their reports.
- Real-time Collaboration: An invaluable aspect of Data Studio is its capacity for real-time collaboration. Multiple users can work on a report concurrently, fostering teamwork and ensuring that reports are continuously updated with the latest information.
- Interactivity: Unlike static reports, those generated in Data Studio can be infused with interactivity. Users can incorporate dynamic elements such as filters, date ranges, and clickable links, enhancing the viewer’s experience and engagement with the content.
- Customization: Data Studio offers a high degree of customization, allowing users to tailor reports to align with their organization’s branding guidelines. From color schemes to overall branding, this feature ensures that reports maintain a professional and cohesive appearance, reflecting the organizational identity.
Getting Started with Google Data Studio
Getting Started with Google Data Studio
Getting started with Google Data Studio involves a series of simple yet essential steps. A prerequisite for accessing the platform is having a Google account. Users can seamlessly transition into Google Data Studio from their Google Cloud Platform (GCP) console, as the platform operates on the cloud, eliminating the need for any cumbersome software installations.
The initial step in creating a report using Google Data Studio is establishing connections to data sources. Whether it’s data residing in a Google Sheet, a BigQuery dataset, or other supported platforms, users can effortlessly integrate their chosen data sources. This flexibility ensures that a wide range of data can be utilized for creating comprehensive reports.
The process of building a report is streamlined through Data Studio’s user-friendly drag-and-drop interface. Users can add various components to their reports, such as charts, tables, scorecards, and more, facilitating the creation of visually appealing and informative presentations of data.
Customization plays a pivotal role in enhancing the visual appeal and coherence of the reports. Users have the option to fine-tune visualizations by adjusting colors, fonts, and styles, ensuring that the final output aligns with the desired brand image or aesthetic preferences.
Adding interactivity to the reports is a crucial aspect of creating an engaging user experience. Google Data Studio enables users to incorporate interactive elements like filters, date pickers, and drill-down options. This not only enhances the usability of the reports but also allows users to explore and analyze data more effectively.
Once the report is ready, Google Data Studio offers seamless sharing and collaboration features. Users can easily share their reports with team members or stakeholders, choosing between view or edit access. Furthermore, the real-time collaboration capabilities enable multiple users to work on the same report simultaneously, fostering efficient teamwork and ensuring that the most up-to-date information is presented. Overall, Google Data Studio provides a comprehensive and user-friendly platform for creating, customizing, and sharing data reports.
Advanced Features and Best Practices
A. Data Blending
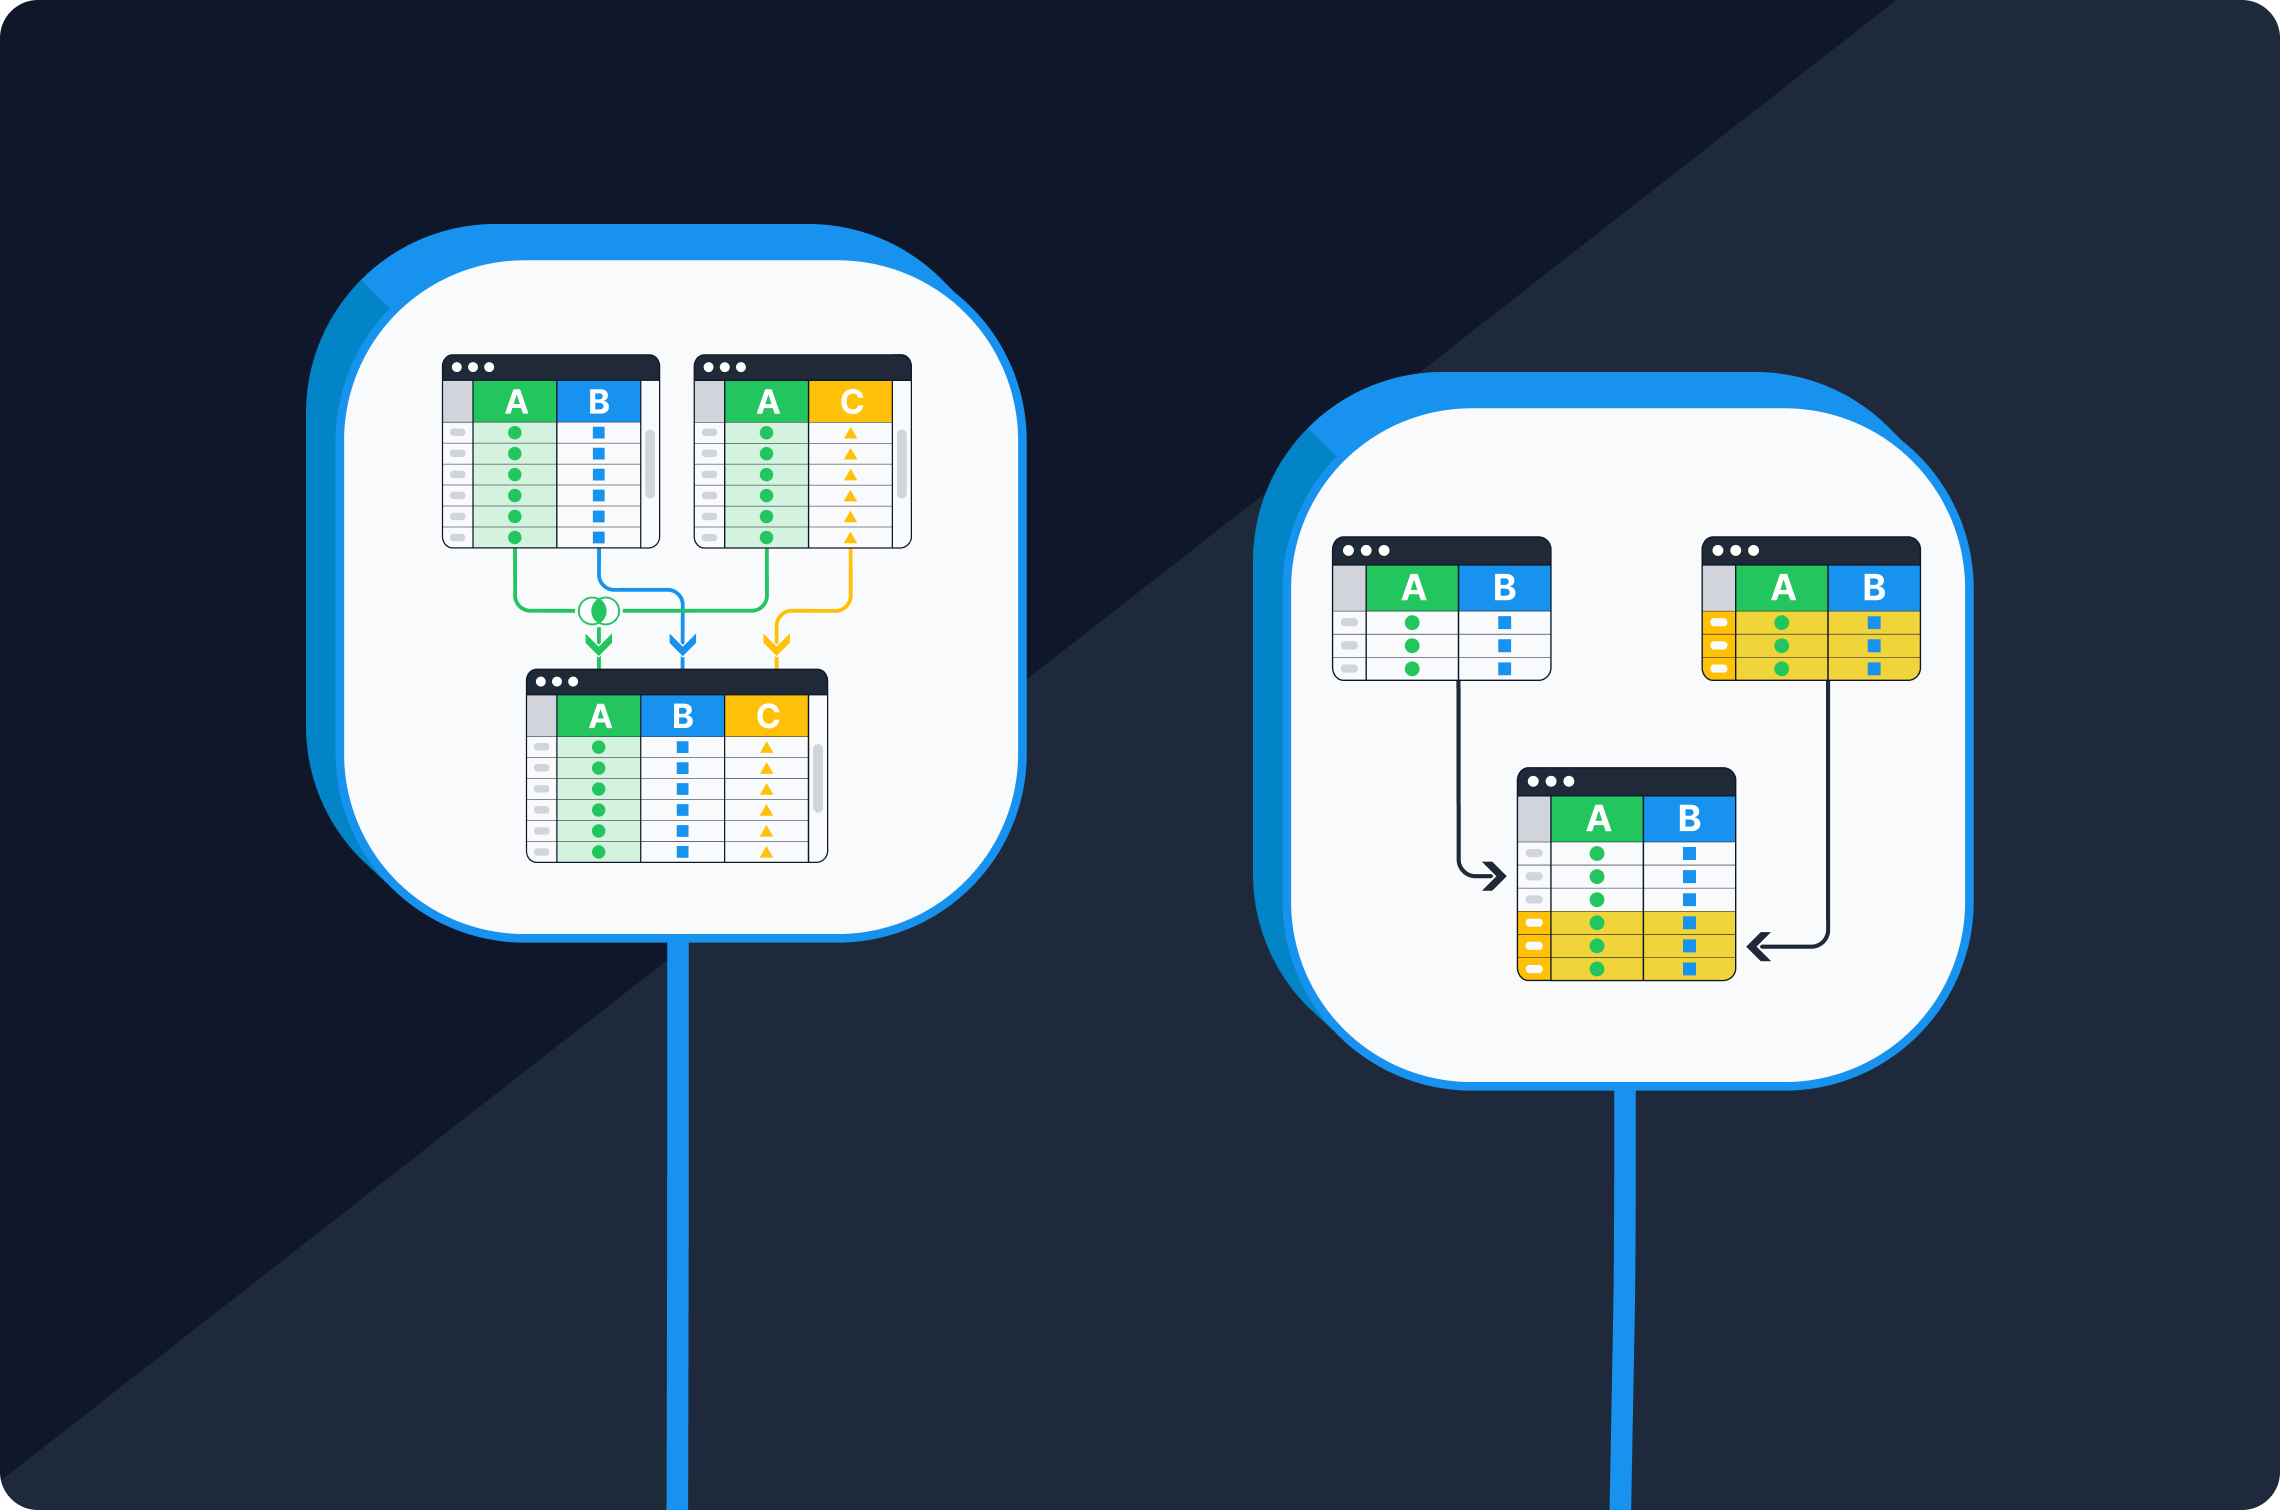
Data Blending
Data blending is a powerful feature in Google Data Studio that enables users to merge data from various sources into a cohesive report. This capability is particularly beneficial when dealing with datasets scattered across different locations or platforms. At the chart level, users can seamlessly blend data, ensuring that the information presented is comprehensive and coherent. By integrating disparate datasets, users can gain a holistic view, facilitating more informed and nuanced analysis within a single, unified report.
B. Calculated Fields and Formulas
Google Data Studio empowers users with the ability to create calculated fields and formulas, offering a dynamic dimension to data analysis. This feature proves invaluable for generating new metrics or conducting custom calculations on the fly. Whether calculating conversion rates, generating cumulative sums, or creating conditional statements, users can enhance the depth of their reports with these dynamic elements. This flexibility allows for tailored, real-time insights, enabling a more nuanced understanding of the data.
C. Community Visualizations and Templates
The Google Data Studio community is a vibrant hub where users contribute custom visualizations and report templates. Leveraging these community resources not only saves time but also introduces diverse and creative elements to reports. Users can enhance both the aesthetics and functionality of their reports by integrating these contributed assets. The community-driven approach fosters innovation, offering users a wealth of options to choose from, ultimately enhancing the overall quality and impact of their reports.
D. Data Studio Best Practices
Organize Your Data: Before diving into report creation, it’s crucial to ensure that your data is well-organized. Clean, structured data streamlines the reporting process, resulting in more accurate visualizations. A systematic approach to data organization lays the foundation for effective and efficient reporting.
- Use Filters Strategically: Filters are potent tools for user interaction with data. However, strategic use is key to avoiding overwhelming users with options. Focusing on providing meaningful filter choices enhances the user experience, enabling them to extract relevant insights without unnecessary complexity.
- Optimize for Performance: As large datasets can impact report performance, optimization is essential. This involves fine-tuning queries, utilizing data sampling when appropriate, and being mindful of the number of visualizations on a single page. Such optimizations ensure a smooth and responsive user experience.
- Test and Iterate: Experimentation is encouraged in Google Data Studio. Testing reports with a sample audience and collecting feedback provides valuable insights. This iterative process allows for refinement, ensuring that reports evolve to maximize their impact and effectiveness. Continuous testing and iteration contribute to the ongoing improvement of data visualizations and analytical outputs.
Use Cases and Industry Applications of Google Data Studio
Marketing and Advertising:
In the realm of marketing and advertising, Google Data Studio emerges as a pivotal tool for professionals seeking comprehensive insights into campaign performance. The platform’s utilization extends to the creation of performance dashboards, allowing marketers to visualize critical metrics such as website traffic, conversion rates, and the efficacy of advertising campaigns. The seamless integration with platforms like Google Ads and Google Analytics positions Data Studio as the go-to solution for marketing experts. This integration enables marketers to synthesize data from various sources, fostering a more holistic understanding of their strategies’ impact.
Sales and E-commerce:
For sales teams and e-commerce businesses, Google Data Studio proves invaluable in the quest for efficient tracking and analysis. Sales professionals can leverage the platform to monitor key sales metrics, delve into customer behavior patterns, and keep a vigilant eye on inventory levels. In the dynamic landscape of e-commerce, the tool facilitates the creation of comprehensive reports encompassing product performance, customer demographics, and evolving sales trends. Such insights empower businesses to make informed decisions, optimize their strategies, and enhance overall performance in the competitive e-commerce market.
Financial Reporting:
Within finance departments, Google Data Studio emerges as a centralized hub for creating detailed and insightful financial reports. Users can exploit the platform’s capabilities to visualize budget versus actual performance, monitor expenses, and generate financial statements. The real-time collaboration feature becomes particularly beneficial for finance teams engaged in budget planning and forecasting. By providing a user-friendly interface and powerful visualization tools, Data Studio streamlines financial reporting processes, contributing to more efficient and accurate decision-making within the financial domain.
Human Resources and Employee Performance:
Human resources departments find a valuable ally in Google Data Studio for tracking employee performance metrics and conducting in-depth analyses of training and development initiatives. The platform facilitates the creation of dashboards tailored for workforce analytics, enabling HR professionals to visualize trends and patterns. This visualization of HR data contributes significantly to identifying areas of improvement, recognizing employee strengths, and making informed decisions to enhance overall organizational effectiveness. The integration of Data Studio in HR practices underscores its versatility and applicability across diverse business functions.
Challenges and Limitations
Learning Curve:
One of the notable challenges associated with Google Data Studio is the learning curve, particularly for users who are new to data visualization and reporting tools. Given the robust set of features and functionalities that Data Studio offers, it may take some time for users to familiarize themselves with the platform. However, to ease this process, Google has provided extensive documentation and tutorials. These resources serve as valuable guides to help users navigate through the various aspects of Data Studio and make the learning experience more accessible.
Data Volume Limitations:
Another challenge arises in the form of data volume limitations. While Google Data Studio is capable of handling a substantial amount of data, there are constraints on the volume of data that can be processed efficiently. This becomes particularly relevant when dealing with extremely large datasets. In such cases, users may need to implement data sampling techniques or explore other optimization strategies to ensure smooth processing and visualization within the tool.
Limited Customization with Basic Plans:
The free version of Google Data Studio comes with certain limitations that organizations should be mindful of. These limitations include constraints on data refresh frequency, sharing options, and customization features. For organizations with more advanced reporting needs and a requirement for greater flexibility in customizing reports, the free version may fall short. To access additional features and overcome these limitations, organizations may need to consider upgrading to the paid version of Data Studio. This move provides access to a more comprehensive set of tools and functionalities that cater to the diverse and complex reporting requirements of advanced users and organizations.
Future Trends and Developments in Data Visualization and Reporting
As the landscape of technology undergoes continuous evolution, it becomes imperative to keep abreast of the upcoming trends and developments within the realm of data visualization and reporting. One platform at the forefront of this domain is Google Data Studio, which is poised to witness advancements in several key areas.
One significant area of development is the integration of AI-driven insights. The increasing integration of artificial intelligence (AI) and machine learning (ML) capabilities is expected to revolutionize Data Studio by enabling it to automatically discern patterns, anomalies, and valuable insights within the data. This would not only streamline the data analysis process but also empower users to make more informed and timely decisions based on the generated insights.
Another noteworthy focus for future updates is the enhancement of collaboration features. Collaborative efforts are integral to many projects, and Data Studio is likely to place a heightened emphasis on facilitating seamless teamwork. This could involve the introduction of features such as inline commenting, providing a real-time communication channel for team members, as well as advanced version history and user permission settings. These improvements would contribute to a more efficient and collaborative reporting environment.
In addition to collaboration features, the expansion of data source integration stands out as a key trend. Google is expected to broaden the spectrum of supported data sources, allowing users to integrate an even more diverse array of datasets into their reports. This expansion not only caters to the growing demand for diverse data but also enhances the overall flexibility and utility of the platform. Users can anticipate a more comprehensive toolbox for integrating, analyzing, and visualizing data from various sources.
The future of data visualization and reporting with Google Data Studio appears promising, with a trajectory toward AI-driven insights, improved collaboration features, and an expanding array of data source integration options. Staying abreast of these anticipated developments is crucial for professionals aiming to harness the full potential of this evolving platform.
Best Practices for GCP Data Studio Reporting
Optimizing Performance:
In the realm of GCP Data Studio reporting, optimizing performance is crucial to ensure a seamless user experience. One key aspect is data source optimization. It involves employing strategies to enhance data source efficiency, thereby contributing to improved report loading times. Techniques such as query optimization and utilizing cached data can be explored to streamline the retrieval of information and reduce latency. Another critical consideration is adhering to report design best practices. Understanding and implementing design principles not only contribute to aesthetically pleasing reports but also significantly enhance user experience and readability. This includes thoughtful layout, effective use of visualizations, and consistent styling throughout the report.
Ensuring Data Security and Compliance:
Data security and compliance are paramount concerns in any reporting system. To address these concerns in GCP Data Studio, implementing access control and permissions is essential. Robust access controls ensure that sensitive data is only accessible to authorized users, preventing unauthorized access and potential data breaches. Additionally, exploring encryption options for data at rest and in transit is crucial. Encryption adds an extra layer of protection, making it challenging for malicious entities to access or manipulate sensitive information. Meeting security and compliance requirements is not only a best practice but often a legal and regulatory necessity.
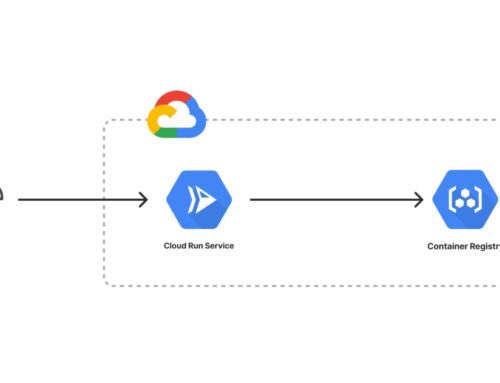
Automating Reporting Processes:
Automation plays a pivotal role in streamlining reporting processes. In GCP Data Studio, one powerful automation feature is the ability to schedule email reports. Learning how to set up automated email reports allows stakeholders to receive key insights at predefined intervals without manual intervention. This not only saves time but also ensures that decision-makers are consistently informed. Another avenue for automation is through API integrations. Exploring the use of APIs facilitates the automation of data extraction and report generation processes. Integrating APIs allows for seamless connectivity between Data Studio and other data sources, enhancing the efficiency and accuracy of reporting workflows. By leveraging automation, organizations can enhance productivity and ensure that reports are generated and disseminated in a timely manner.
Real-world Use Cases and Success Stories
Industry-specific Applications:
E-commerce Analytics:
In the realm of e-commerce, GCP Data Studio proves to be a powerful tool for comprehensive sales analysis, customer behavior tracking, and marketing performance measurement. E-commerce businesses can utilize this platform to gain valuable insights into their sales trends, understand customer preferences and behaviors, and evaluate the effectiveness of their marketing strategies. Through intuitive visualizations and analytics provided by GCP Data Studio, businesses can make informed decisions to enhance their overall performance and stay competitive in the dynamic e-commerce landscape.
Healthcare Analytics:
GCP Data Studio offers healthcare organizations a robust solution for patient data visualization, operational analytics, and compliance reporting. By leveraging the capabilities of this platform, healthcare professionals can create visually compelling representations of patient data, facilitating better understanding and decision-making. Operational analytics help streamline internal processes, leading to improved efficiency, while compliance reporting ensures adherence to regulatory standards. The integration of GCP Data Studio in healthcare analytics enhances the sector’s ability to deliver high-quality care and meet the stringent requirements of the industry.
Case Studies:
Optimizing Ad Campaigns:
A digital marketing agency achieved remarkable success by harnessing the power of GCP Data Studio to optimize its ad campaigns. Through detailed analysis and visual representation of key metrics, the agency was able to identify underperforming aspects of their campaigns and make data-driven adjustments. The result was a significant increase in return on investment (ROI), showcasing the platform’s effectiveness in transforming marketing strategies. This case study serves as a testament to the practical application of GCP Data Studio in driving tangible results for businesses operating in the digital marketing domain.
Financial Reporting:
In the financial sector, a case study highlights how a financial institution streamlined its reporting processes with GCP Data Studio, leading to enhanced decision-making capabilities. The platform’s capabilities allowed the institution to create clear and concise financial reports, improving the speed and accuracy of information dissemination. This not only optimized internal workflows but also provided decision-makers with real-time insights, ultimately contributing to more informed and strategic financial decisions. The case study underscores GCP Data Studio’s relevance in the financial industry, where precision and efficiency are paramount.
Conclusion
Google Data Studio is a powerful and versatile tool that empowers organizations to transform their data into meaningful and actionable insights. Whether you’re a marketer, analyst, or business owner, the ability to create visually appealing and interactive reports is invaluable in today’s competitive landscape. By understanding the features, best practices, and industry applications of Data Studio, businesses can harness the full potential of their data to drive success. As the tool continues to evolve, staying informed about new features and trends will be key to maximizing its impact on data reporting and analysis.


