
Introduction:
Customer Relationship Management (CRM) is a strategic approach that businesses use to manage and analyze interactions with their current and potential customers. It involves utilizing technology to organize, automate, and synchronize sales, marketing, customer service, and technical support processes. CRM aims to enhance customer satisfaction and foster long-term relationships, ultimately driving business growth.
Definition of CRM:
CRM encompasses a set of practices, strategies, and technologies that companies employ to manage and analyze customer interactions throughout the customer lifecycle. It involves collecting and analyzing customer data, streamlining communication channels, and improving overall customer experience. CRM systems typically include features for contact management, lead management, sales automation, and customer service.
Significance of Reporting and Analytics in CRM:
Reporting and analytics play a crucial role in CRM as they empower businesses to derive actionable insights from the vast amount of customer data collected. By utilizing reporting tools, businesses can track key performance indicators (KPIs), measure the success of marketing campaigns, analyze sales performance, and understand customer behavior. Analytics enable businesses to make informed decisions, identify areas for improvement, and tailor their strategies to meet customer needs effectively.
Salesforce as a Leading CRM Platform:
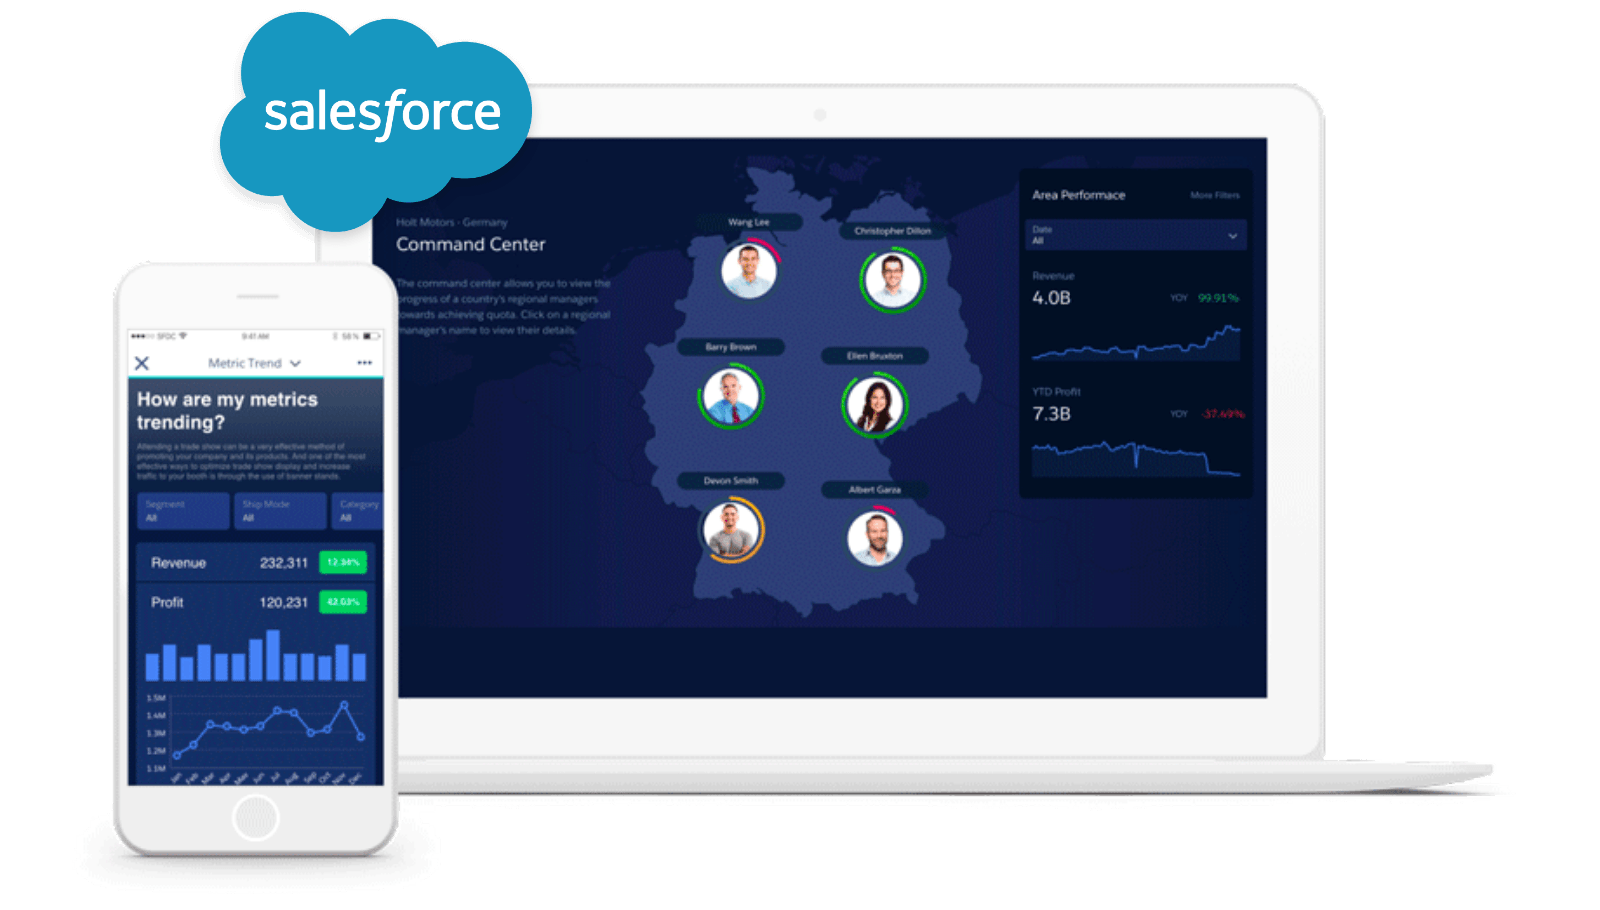
Salesforce is a prominent and widely used CRM platform that has gained popularity for its comprehensive set of features, scalability, and user-friendly interface. As a cloud-based solution, Salesforce allows businesses to manage customer information, track sales leads, streamline communication, and automate various processes. It provides a unified platform for sales, marketing, and customer service teams to collaborate and deliver a seamless customer experience.
Salesforce’s ecosystem includes a variety of applications and tools that extend its functionality, such as Salesforce Sales Cloud for sales automation, Salesforce Marketing Cloud for marketing campaigns, and Salesforce Service Cloud for customer support. Moreover, Salesforce’s AppExchange marketplace offers a vast array of third-party applications and integrations that further enhance its capabilities.
CRM is a strategic approach to managing customer relationships, and the integration of reporting and analytics is crucial for extracting valuable insights. Salesforce stands out as a leading CRM platform, offering a robust suite of tools to streamline various aspects of customer relationship management and contribute to the overall success of businesses in today’s competitive market.
Understanding Salesforce CRM Reporting
Salesforce CRM (Customer Relationship Management) is a powerful platform that helps organizations manage their interactions with customers and prospects. Reporting in Salesforce is a crucial feature that allows users to analyze data, gain insights, and make informed decisions. Reporting tools in Salesforce enable users to create and customize various types of reports, providing a comprehensive view of their data.
Basics of Salesforce Reports:
- Report Types: Salesforce offers various report types, each tailored to specific use cases. Standard report types include Tabular, Summary, and Matrix reports. Tabular reports present data in a simple table format, while Summary reports group data for a summarized view. Matrix reports combine both tabular and summary features for a comprehensive analysis.
- Report Builder: Salesforce provides an intuitive Report Builder that allows users to drag and drop fields, apply filters, and define criteria to create reports. This tool simplifies the process of generating meaningful insights without requiring extensive technical expertise.
- Data Sources: Reports in Salesforce can pull data from different objects, giving users the flexibility to analyze information from various perspectives. Users can include fields from related objects in their reports to create comprehensive and interconnected insights.
Types of Reports:
- Tabular Reports: These present data in rows and columns, similar to a spreadsheet, providing a detailed list view of records.
- Summary Reports: These group data based on specified criteria, offering a higher-level view with subtotals.
- Matrix Reports: Matrix reports organize data in a grid format, combining both tabular and summary features.
- Joined Reports: This type allows users to combine multiple report types into a single report for a more comprehensive analysis.
Customizing Reports in Salesforce:
- Filtering and Sorting: Users can customize reports by applying filters to focus on specific criteria and sorting options to organize data in a meaningful way.
- Charting and Graphs: Salesforce enables users to visualize data by incorporating charts and graphs into their reports, making it easier to identify trends and patterns.
- Formula Fields: Users can create custom formula fields within reports to perform calculations and display derived data.
- Scheduled Reports: Salesforce allows users to schedule the automatic generation and distribution of reports, ensuring stakeholders receive up-to-date information without manual intervention.
Salesforce CRM reporting is a versatile feature that empowers users to extract valuable insights from their data, aiding in strategic decision-making and performance analysis. The flexibility and customization options within Salesforce reporting make it a powerful tool for businesses of all sizes.
Salesforce Analytics
Salesforce Analytics is a powerful tool within the Salesforce ecosystem that allows businesses to gather insights and make data-driven decisions.
Introduction to Salesforce Analytics:
Salesforce Analytics is a suite of tools and features designed to help organizations analyze and visualize their data within the Salesforce platform. It enables users to turn raw data into actionable insights, facilitating better decision-making processes. The analytics capabilities extend across various Salesforce products, providing a comprehensive solution for businesses to understand their performance, customer behavior, and overall business health.
Differences between Reporting and Analytics:
While reporting and analytics may sound similar, there are distinct differences between the two within the Salesforce context:
- Reporting:
Involves creating and displaying data in a structured format.
Primarily focuses on summarizing information and generating predefined reports. Offers a snapshot of current data but may have limitations in providing deeper insights.
- Analytics:
Goes beyond basic reporting by offering advanced data analysis and visualization. Allows users to explore data, identify trends, and discover hidden patterns. Provides a more dynamic and interactive experience, empowering users to ask complex questions and derive meaningful insights.
Benefits of Analytics in CRM:
Informed Decision-Making: Analytics empowers businesses to make informed decisions based on real-time data and historical trends.
Enhanced Customer Understanding: By analyzing customer data, businesses gain a deeper understanding of customer preferences, behavior, and needs, enabling more personalized interactions.
Improved Sales Performance: Sales teams can leverage analytics to identify sales trends, forecast future sales, and optimize their strategies for better performance.
Efficient Resource Allocation: Analytics helps in identifying areas of improvement and optimizing resource allocation by focusing on what works best for the business.
Proactive Issue Resolution: Businesses can use analytics to identify potential issues before they escalate, allowing for proactive problem-solving and customer satisfaction.
Strategic Planning: Analytics provides valuable insights for long-term strategic planning, helping businesses align their goals with market trends and customer demands.
Key Components of Salesforce CRM Reporting and Analytics
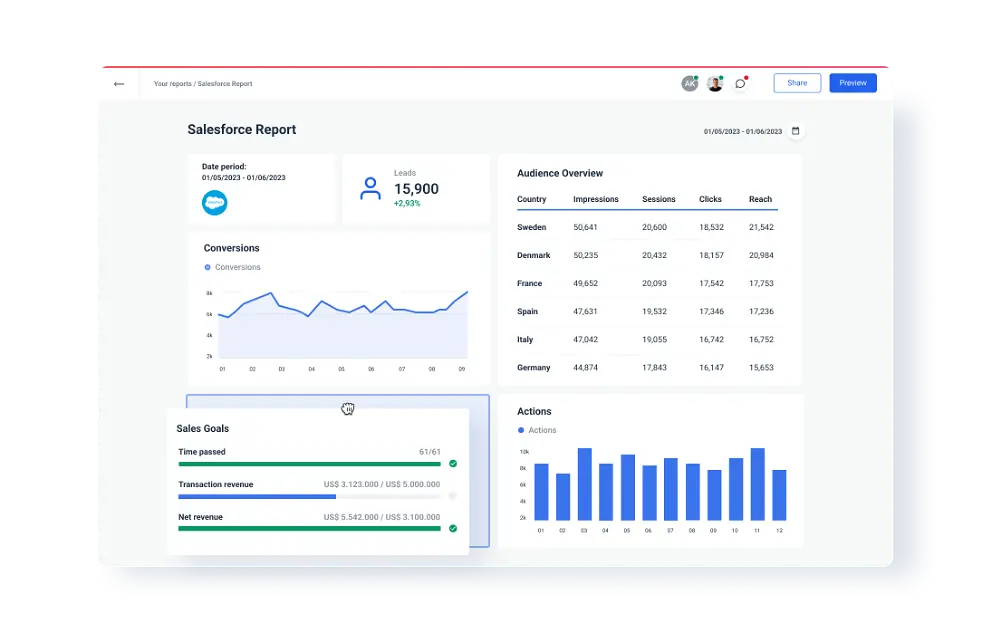
Dashboards:
- Dashboards in Salesforce are visual representations of your data that offer a consolidated view of key metrics and performance indicators.
- Customization: Users can create personalized dashboards by selecting components such as charts, tables, and metrics, and arrange them to meet their specific needs.
- Real-time Data: Dashboards are interactive and often display real-time data, providing users with the most up-to-date information.
Charts and Graphs:
- Visual Data Representation: Salesforce supports a variety of chart types, including bar charts, pie charts, line graphs, and more, to represent data visually.
- Drill-Down Capabilities: Users can interact with charts to drill down into specific data points, allowing for a deeper understanding of trends and patterns.
Key Performance Indicators (KPIs):
- Tracking Goals: KPIs are measurable values that indicate how well a business is achieving its objectives. Salesforce allows users to define and track KPIs relevant to their business processes.
- Monitoring Success: Users can set up alerts or notifications based on KPI thresholds to stay informed about performance and take timely actions.
Customizable Metrics:
- Tailored Analytics: Salesforce allows users to define and track custom metrics based on their unique business requirements. This flexibility ensures that organizations can measure and analyze data that is specific to their industry or operations.
- Data Calculations: Users can perform calculations on custom metrics, providing a more detailed and nuanced analysis of their data.
Salesforce CRM’s reporting and analytics tools empower users to transform raw data into meaningful insights. Dashboards, charts, KPIs, and customizable metrics are integral components that enable businesses to monitor performance, make informed decisions, and optimize their processes. The flexibility and user-friendly interface of these tools contribute to the effectiveness of Salesforce as a comprehensive CRM solution.
Creating Effective Salesforce Reports
Step-by-Step Guide to Building Reports:
- Start by navigating to the Reports tab in Salesforce.
- Click on the “New Report” button to initiate the report creation process.
- Choose the report type that aligns with the data you want to analyze (e.g., Accounts and Contacts, Opportunities, Cases).
- Define the report format (Tabular, Summary, Matrix) based on how you want the data to be presented.
- Select the fields you want to include in the report, ensuring they provide relevant information for your analysis.
- Apply any necessary filters to focus the report on specific criteria or timeframes.
Utilizing Filters and Criteria:
- Filters allow you to narrow down the data displayed in your report based on specific conditions.
- Utilize standard filters (e.g., date range, record type) or create custom filters to tailor the report to your needs.
- Combine multiple filters to create complex criteria that precisely define the data set you want to analyze.
- Preview the report as you apply filters to ensure the results meet your expectations.
Grouping and Summarizing Data:
- Group data to organize it hierarchically, making it easier to identify patterns and trends.
- Use grouping to categorize data by a specific field, such as grouping opportunities by sales representative or region.
- Summarize data to calculate totals, averages, or other aggregate values for grouped information.
- Utilize summary formulas to perform calculations on numerical fields within the report.
Exporting and Sharing Reports:
- Export reports in various formats (CSV, Excel, PDF) to share with team members or stakeholders.
- Schedule reports to be automatically emailed to specific recipients at regular intervals.
- Customize report dashboards to provide an at-a-glance overview of key metrics.
- Share reports with specific users or groups in Salesforce, controlling access to sensitive information.
- Leverage Salesforce features like Chatter to collaborate on and discuss report findings within the platform.
Advanced Reporting Features in Salesforce
Cross-Object Reporting:
Cross-object reporting in Salesforce allows users to create reports that span across multiple objects in the database. Objects in Salesforce are similar to database tables, and they store data records. Cross-Object Reporting enables users to extract insights from related objects and fields in a single report. For example, you can create a report that shows information from both the Opportunity and Account objects, providing a comprehensive view of the data relationships.
Joined Reports:
Joined Reports take cross-object reporting a step further by allowing users to combine multiple report blocks in a single report. Each report block can represent data from a different object or record type, and these blocks are joined together on a common field or relationship. This feature enables users to analyze and compare data from various sources within a single report, facilitating a more holistic understanding of the information.
Bucketing and Historical Reporting:
Bucketing is a feature in Salesforce reporting that allows users to categorize and group records based on specific criteria. It is particularly useful when dealing with numerical or date-based data. Historical Reporting involves analyzing data changes over time. Salesforce provides features to track historical changes in certain fields, enabling users to create reports that show how data has evolved over different periods. For instance, you can create a report that buckets opportunities by their revenue size or track changes in an account’s ownership over time.
Dynamic Dashboards:
Dynamic Dashboards in Salesforce allow users to create dashboards that can be customized based on the viewer’s profile or preferences. This ensures that each user sees relevant and personalized information on the dashboard. Users can set up dynamic filters, conditional highlighting, and other interactive elements to make dashboards more responsive to individual needs. A sales manager might see a dynamic dashboard that focuses on team performance, while a marketing manager could have a dashboard emphasizing campaign metrics.
Security and Compliance in Salesforce Reporting

Role-based Access Control (RBAC):
- RBAC is a method of restricting system access to authorized users. In Salesforce Reporting, RBAC ensures that users have the appropriate level of access to data based on their roles within the organization.
- Implementation: Salesforce allows administrators to define roles and assign specific permissions to each role. Users are then assigned to these roles, dictating what data they can access and what actions they can perform within Salesforce Reporting.
- Benefits: RBAC enhances security by limiting access to sensitive information, preventing unauthorized users from viewing or modifying critical data.
Data Encryption and Masking:
- Encryption: Salesforce employs encryption mechanisms to protect data at rest and during transit. This ensures that even if unauthorized access occurs, the data remains unreadable without the proper decryption keys.
- Masking: Data masking involves concealing specific portions of sensitive information, allowing users to access only the information they need. In Salesforce Reporting, this ensures that sensitive data is not exposed to users who don’t require full access.
- Benefits: Encryption and masking together provide a robust defense against data breaches, ensuring that even if unauthorized access occurs, the exposed data is rendered useless without the proper permissions.
Compliance with Industry Regulations:
- Salesforce is designed to comply with various industry-specific regulations and standards, such as GDPR, HIPAA, and others. Compliance ensures that organizations using Salesforce for reporting adhere to legal requirements and industry best practices.
- Implementation: Salesforce provides tools and features that help organizations configure their systems to meet specific compliance standards. This includes features like audit trails, data retention policies, and compliance dashboards.
- Benefits: Compliance with industry regulations not only helps organizations avoid legal issues and penalties but also builds trust among users and customers, showcasing a commitment to protecting sensitive information.
Salesforce Reporting prioritizes security and compliance through measures such as Role-based Access Control, Data Encryption and Masking, and adherence to industry regulations. These features work together to create a secure environment for reporting, ensuring that sensitive data is protected and accessible only to authorized individuals.
Future Trends in Salesforce CRM Reporting and Analytics
Artificial Intelligence and Machine Learning Integration:
- Automation of Routine Tasks: AI and machine learning (ML) integration in Salesforce CRM reporting will enable automation of routine tasks such as data entry, categorization, and analysis. This will save time and reduce manual efforts, allowing users to focus on more strategic aspects of their work.
- Predictive Insights: AI and ML algorithms will provide predictive insights by analyzing historical data. This can help businesses anticipate customer needs, identify trends, and make data-driven decisions more effectively.
- Personalized Recommendations: By leveraging AI, Salesforce CRM reporting can offer personalized recommendations based on individual user behavior, helping sales and marketing teams tailor their strategies to specific customer preferences.
Predictive Analytics Advancements:
- Forecasting and Trend Analysis: Predictive analytics will become more sophisticated in forecasting future trends and analyzing historical patterns. This will empower businesses to make proactive decisions and stay ahead of market changes.
- Churn Prediction: Salesforce CRM reporting will integrate advanced predictive models to identify potential customer churn. This will enable businesses to take preemptive actions to retain customers and enhance customer satisfaction.
- Sales Pipeline Optimization: Predictive analytics will play a crucial role in optimizing the sales pipeline by identifying high-value opportunities and predicting the likelihood of deals closing successfully.
Enhancements in Data Governance:
- Data Quality Management: Improved data governance will focus on maintaining high data quality. Salesforce CRM reporting will implement measures to ensure accurate, consistent, and up-to-date information, reducing errors and enhancing decision-making.
- Compliance and Security: Enhanced data governance will address compliance requirements and data security concerns. This is crucial in industries with strict regulatory standards, ensuring that Salesforce CRM reporting systems adhere to privacy and data protection regulations.
- Data Integration Across Platforms: Efforts will be made to streamline data integration across various platforms and sources. This will provide a unified view of information, making it easier for users to access and analyze data seamlessly within the Salesforce CRM environment.
Challenges and Solutions in Salesforce Reporting and Analytics
Data Quality and Cleansing Issues:
- Challenge: Inaccurate or inconsistent data can significantly impact the reliability of reports and analytics. This may arise due to human errors during data entry, duplicate records, or outdated information.
- Solution: Implement data validation rules, data cleaning processes, and regular audits to ensure data accuracy. Automation tools and third-party applications integrated with Salesforce can help in maintaining data integrity. Establishing data governance practices and educating users on the importance of accurate data entry can also contribute to improving data quality.
User Adoption Challenges:
- Challenge: Even with powerful reporting tools, if users are not comfortable or motivated to use them, the system’s potential remains untapped. Resistance to change and a lack of training can hinder user adoption.
- Solution: Provide comprehensive training programs to users, highlighting the benefits of Salesforce reporting and analytics. Offer ongoing support and resources to address any user concerns. Customized dashboards and reports tailored to specific user roles can enhance the user experience. Demonstrating how these tools can streamline their daily tasks and improve decision-making can encourage adoption.
Addressing Common Pitfalls:
- Challenge: Users may fall into common pitfalls such as misinterpreting data, creating overly complex reports, or overlooking important features of the Salesforce reporting platform.
- Solution: Conduct regular workshops or training sessions to educate users on best practices for creating meaningful and accurate reports. Establish guidelines for report creation and encourage collaboration among users to share insights and techniques. Provide documentation and resources to help users navigate potential pitfalls, and consider leveraging the Salesforce community for shared knowledge and experiences.
Conclusion
In conclusion, Salesforce CRM reporting and analytics are indispensable tools for organizations aiming to thrive in the competitive business landscape. This comprehensive guide has explored the fundamentals of Salesforce reporting, delved into the intricacies of analytics, and provided insights into advanced features and best practices. As technology continues to evolve, Salesforce remains at the forefront, enabling businesses to make data-driven decisions and forge stronger connections with their customers.


